Smoothish library for smoothing time series data
[Updated 5-May-2020 to change the examples to the new 1.0.0 API.]
I published a new npm module called smoothish that smooths out time-series data without some of the drawbacks of the usual moving-point average.
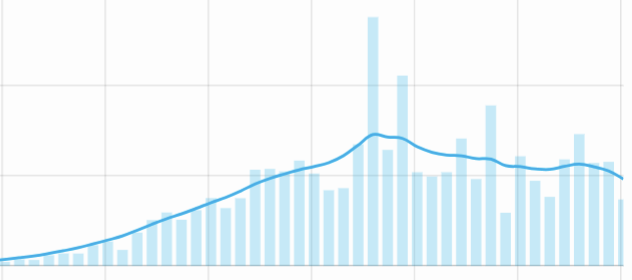
When working on the visualization of per-capita COVID-19 death rates I needed a way to smooth out the curves of some noisy and incomplete data, and I wanted the data to extend up to the most recent day.
Standard moving-average did not meet those requirements, so I ended up writing my own smoothing function which you can use like a moving average, but it does not drop the points at the beginning or (more importantly) at the end.
It works by, at every point, doing a least-squares linear interpolation of other points nearby. It is flexible enough to handle missing points or points at the boundaries.
It's easy to use. In your JavaScript project install it with:
npm install smoothish
Then using it is as simple as:
const smoothish = require('smoothish')

const daysPerMonth = [
    31, 28, undefined, 30, 31, null, 31, 31, null, 31, 30, 31]

smoothish(daysPerMonth)
// --> [ 30.0, 29.4, 29.8, 30.1, 30.5, 30.6, 30.8, 30.8, 30.8, 30.7, 30.6, 30.7 ]
Note, that not only does it produce a smoothed output, but it also interpolates missing values.
By default the function uses a radius of 2, indicating the width of the neighborhood of other points to be considered. All points are actually considered by default, but with the ones closer having more weight falling off exponentially with a time constant of the radius.
The smoothish functions also has options to do moving average and to have a step-function falloff, just like a normal moving average. In that case a radius of 2 would specify a five-point moving average.
The smoothish function always returns the same number of output values as in the input.
